

Are you wondering how to make the best flowchart ever? You’ve come to the right place. Fasten your seatbelts and be ready to travel to the world of laconic and clear flowcharts. When we finish, you’ll be ready to create your greatest flow sheet.
What is a Flowchart?
A flowchart is a graphical representation of business processes designed to explain complex things in simple words. Its essence is reflected in the name — chart of a flow.
Long story short, it’s a diagram made of forms and symbols that depict a process or algorithm. These forms are connected with arrows to show the direction of process flow.
Flowcharts are used to plan, document, study, communicate. Complex processes are depicted as clear and simple diagrams. Everyone can understand the message.

General Flowchart Symbols
- The Oval means a beginning or an end. That’s why it’s also called ‘terminator’. Start and end your flowchart with this shape.
- The Rectangle is one step of the process and the most frequently-used shape. Every step in the business process depicted should be represented with it.
- The Arrow indicates directions. It connects flowchart parts and helps to tell the whole story: exposition, climax, and resolution.
- The Diamond means a decision. Be it a binary, one-of-three or even complex decision, it has its own subsequent story.
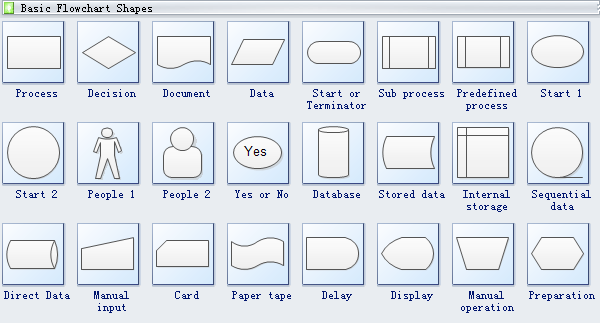
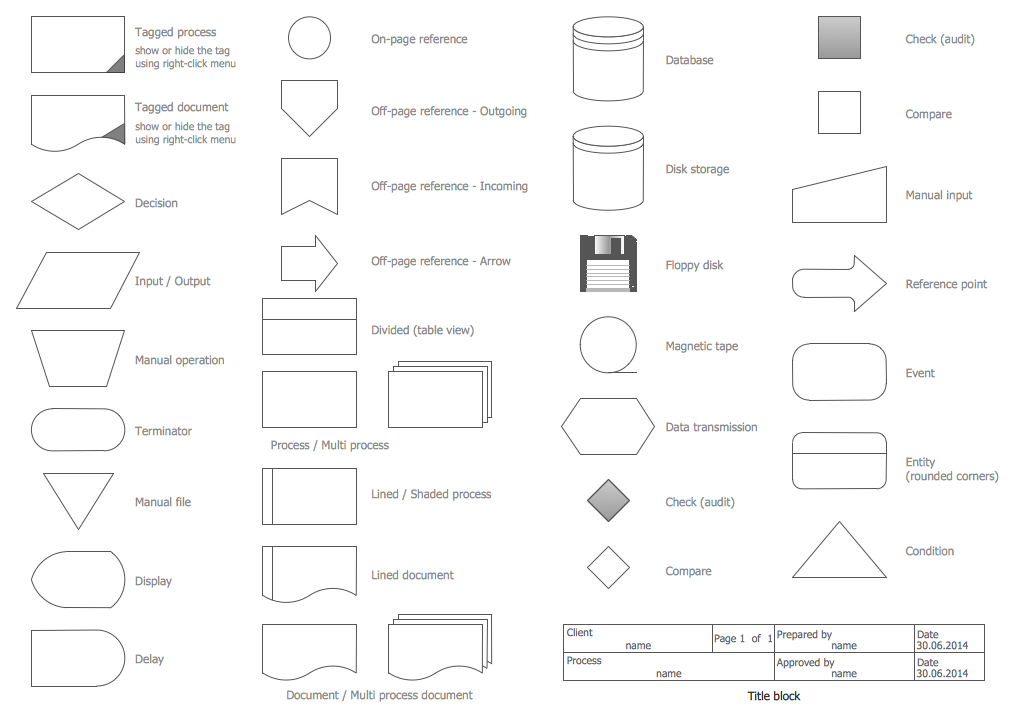
Also, besides these basic symbols, there are special ones:
- Document symbols
- Data symbols
- Input and output symbols
- Merging and connecting
- Other shapes
How to Make a Flowchart
Once you know the shapes’ roles, start creating your professionally-designed flow-sheet! First, follow these basic principles:
- Create a list of core concepts. They should be intuitive and clear. The steps of the process should be simple and easy to understand. The success of any flowchart is in its readability.
- Choose the format. It can be standard and swimlane. The first one is suitable for simple processes with only the main concepts and possible actions. The latter fits process works performed by several teams. So, every team takes its ‘swimlane’.
- Define a set of symbols to use. That may be your company standard.
- Start with an oval terminator box. Think about what goes next and add arrows to describe the flow.
- Divide complex processes into parts. Too dense illustrations might be impossible to read. Separate sub processes into another chart. Add a link to a new one while designing your digital flowchart.
- Finally, share the scheme with others. Make sure it is used as a formal system by other teammates.

Creating a Flowchart with Word
The first popular way to manage our today’s main task is the most well-known text processor. Here are the main steps:
- Create a canvas. From the ‘Insert’ tab, go to the ‘Shapes’ menu, and select ‘New Drawing Canvas’.
- Click on your canvas to activate the grid. Set it in the ‘Format’ tab by clicking ‘Align’ and ‘Grid Settings’.
- Add and connect shapes. Return to the ‘Insert’ tab and proceed to ‘Shapes’. Format blocks in the self-titled tab. If you select an arrow, start near the first shape, drag and drop it.
- Add text and comments. Just start typing on the shape of your choice. Edit the text format via the tools panel.
Disadvantages:
- Word is primarily a text processor, so creating a flow diagram can be quite challenging.
- If you are not an advanced Word user, the process may take you more than several hours.
How to Do a Flowchart with Excel
The whole process is very similar to the previous one.
- Set a grid. Select all cells on your spreadsheet. Select ‘Column Width’ from the right-click menu and set it as ‘2.14’. All cells will become square.
- Line up margins. This is necessary only for exporting your flowchart to other apps, e.g. MS Word. In the ‘Layout’ tab, select ‘Margins’.
- Add and connect shapes. In the ‘Insert’ tab, click ‘Shapes’. Add blocks you need and format them in the ‘Format’ tab.
- Add text and comments. Just click on the cell you want to fill with text. Be concise and brief.
Disadvantages:
- The complexity of the process. People consider Excel even more difficult to use than Word!
- It’s a long process, so some people prefer buying templates for Excel. Still, they may cost not even fifty dollars!

Create a Flowchart with Powerpoint
Since MS Office is a holistic tool, the actions are very similar to the previous point.
- Set a grid. Go to ‘View’ > ‘Show’ and check the ‘Gridlines’ box.
- Add shapes. Visit the ‘Insert’ tab, select ‘Illustrations’ > ‘Shapes’. Note, there are special ‘Lines’ and ‘Flowchart’ sections. Connect different shapes with lines. Edit their format in the main toolbar.
- Type texts. Click on the shape and start typing. Add comments to the lines if necessary.
Disadvantages:
- Though this tool is more comfortable than previous ones, creating a chart may take the whole day.
Creating a Flowchart with Google Docs
If you like Google’s Office Suite more than MS Office, here is a short manual for you!
- Create a file for your flowchart. Once you’ve opened a Docs file, select ‘Insert’ > ‘Drawing’ > ‘New’.
- Add shapes. From the ‘Drawing’ tab, click the icon with a circle and a square in it. Proceed to ‘Shapes’ and select the one you need.
- Connect them. Choose the line tool (the icon with an arrow in it) and draw a line.
- Format shapes and lines. To change their design, select a shape or line, click on ‘Fill Color’.
- Add your flowchart to the document. Once your chart is ready, clicking on ‘Save and close’. It will appear in your Google Document.
Disadvantages:
- The long and complex process for those who have never created flowcharts before.

Step-by-Step Creating a Flowchart with FlowMapp
Using a flowchart software is the best solution for people who are aimed at getting the fastest and best results. FlowMapp is tailored especially to the needs of both professionals and amateurs who want to save time and increase productivity.
With our app, you can easily create:
- Sitemaps
- User flows
- Personas
- Customer journey maps (CJM)
Let’s start creating, for example, a user flow
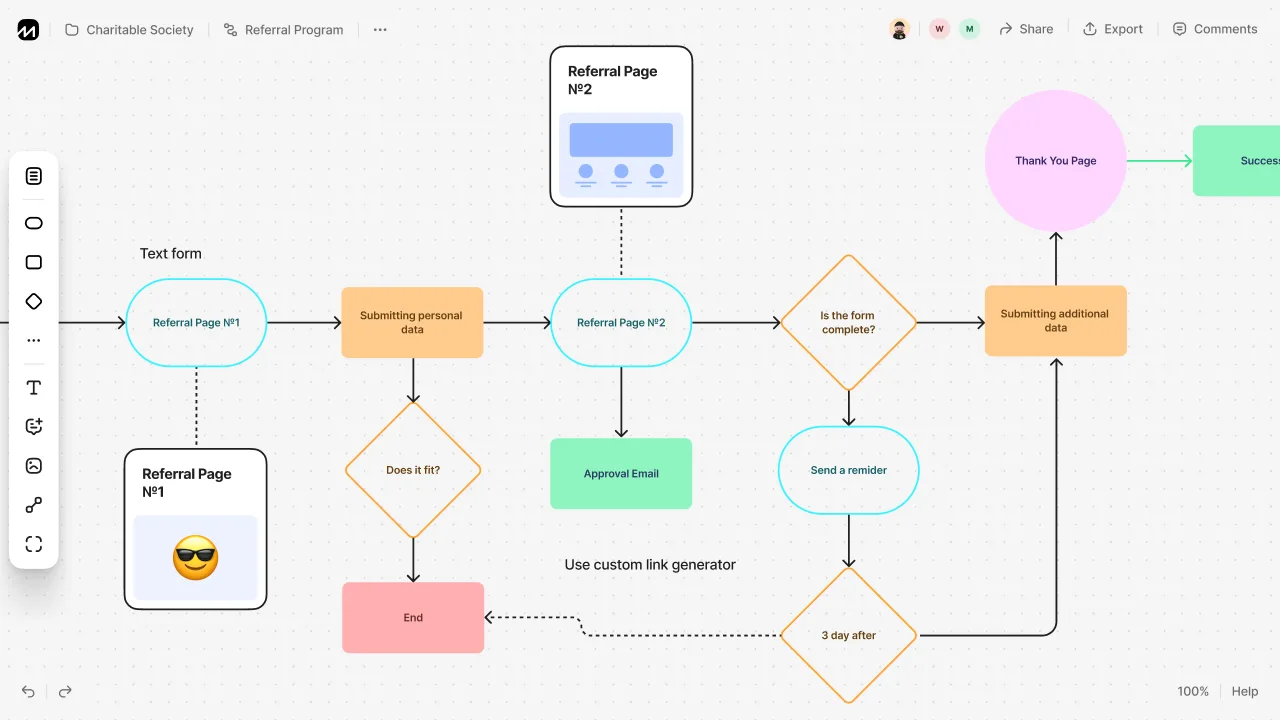
Flowchart Example
Explore the examples of flowcharts done in FlowMapp. The good news is that a brilliant design does not require long days of hard work!
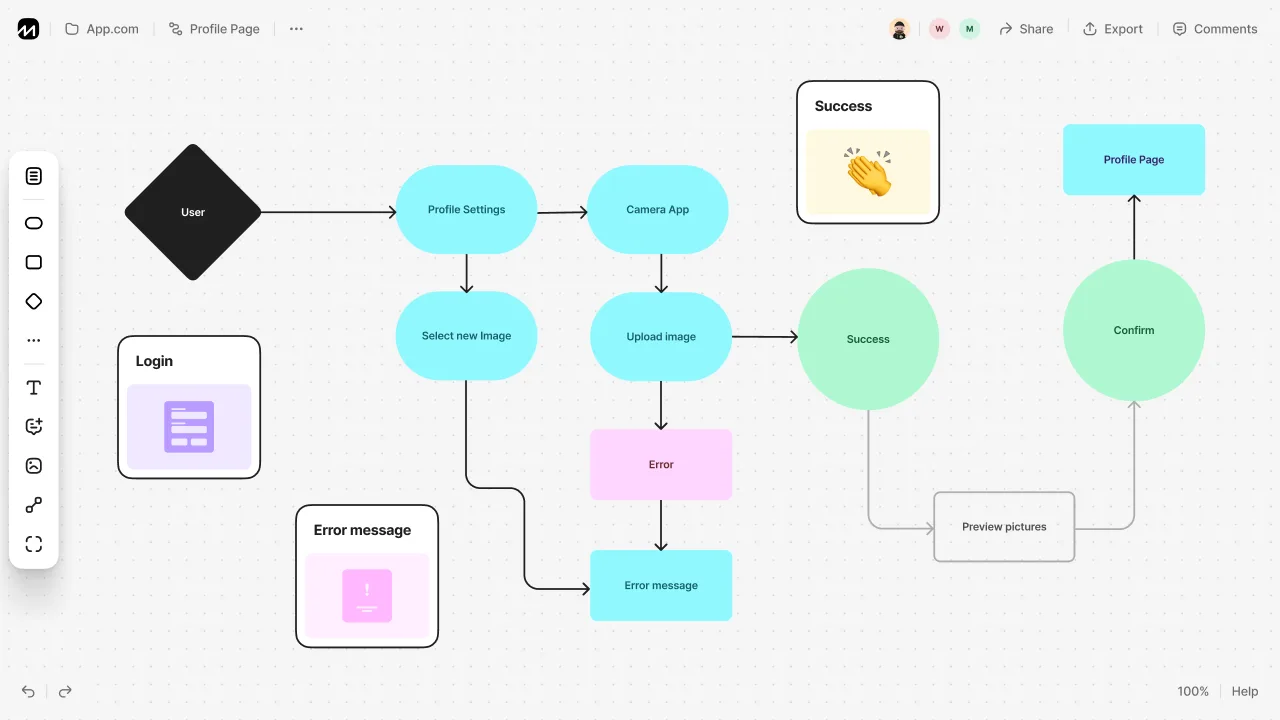
This is an informative yet easy to understand user journey:
Advantages of Flowchart Creating with FlowMapp
- Professional results. Your design will be more advanced than if you made it in Word or Excel.
- Simplicity. Everyone can do this, even without special skills and previous experience.
- Variety of tools. Create user flowcharts, personas, CJMs, and sitemaps. You can use all of them at once by integrating one into another.
- Intuitive customizing. Design blocks, format text, add images, and enjoy effortless formatting via intuitive pop-up panel tools.
- Icon library. A handful of free icons will make your concept more clear and obvious.
- Endless working space for many user flows. Enjoy literally endless space and add as many flowcharts, sitemaps, CJMs as you need.
- Export and sharing opportunities. Share in the web format, export in an image, PDF or SVG.
- Collaboration. Work on your project with the entire team!

7 Bonus Tips: Best Practices of Drawing Effective Flowcharts
- Use standard symbols, if you want to share your scheme. It should be understood by everyone who looks at it.
- Be careful with colors and sizes. Don’t “overdesign” your flow diagram. This saturates the scheme with informational noise.
- Set a unified spacing value. Stick to the middle ground when choosing spacing between shapes.
- Keep all data on one page. Shorten your flowchart or divide it into parts, if it’s too large.
- Use the ‘Right to Left’ flow, not ‘Left to Right’. People read like this, so they will perceive the data quicker and more intuitively.
- Use a ‘Split path’, not a ‘Decision’. Though we have a Diamond symbol, people find a ‘Split path’ (a rectangle with two arrows) easier to understand.
- Return lines should be placed under your flowchart. Some people place it above their diagrams, but this can be distracting.
The Bottom Line
Congrats! You now know basically everything to start creating your perfect process flowchart!
- Think out the concept you want to depict.
- Choose the tool from what we’ve reviewed.
- Start creating your chart using our manual from this article! ;)
Feel free to ask questions in the comments or to address our support team if you need some help!